Getting data from the GitHub API
Earlier this week I was watching videos from Plotly’s Plotcon which took place in New York earlier in November 2016. Kent Russell, better known as timelyportfolio, gave an interesting talk about the power combining different tools and languages to produce great work. Kent is well known in the R community for all the brilliant work he has done with htmlwidgets and bringing various web-based visualisation tools (think D3.js and other JavaScript libraries) in to R.
At one point Kent mentioned his GitHub stars, revealing that he has personally starred over 10,000 repositories. He joked that most of them are probably long-abandoned and mused that it might be interesting for someone to take a look at that. I thought it might be. So I have.
Accessing the GitHub API from R
Getting access to the GitHub API was relatively painless thanks to a still-in-development package being worked on by some R “heavy-hitters” called gh. I also used a number of other tidyverse packages to help me in my analysis.
library(tidyverse)
library(lubridate)
library(stringr)
library(readr)
library(gh)
I created an access token for the API by following the instructions before exporting that to an environment variable named GITHUB_PAT (which is what gh functions look for).
$ export GITHUB_PAT=[my access token]I was then able to grab the list of all Kent’s starred repositories very easily:
timely_stars <- gh("/users/timelyportfolio/starred", .limit = Inf)Setting .limit to Inf ensured that I got all Kent’s stars (otherwise the function uses the API default of 10).
Following the example on the gh’s GitHub page I then pulled out bits of the response that I wanted to use into a tidy tibble.
stars <- tibble(
  repo = vapply(timely_stars, "[[", "", "name"),
  url = vapply(timely_stars, "[[", "", "url"),
  created = vapply(timely_stars, "[[", "", "created_at"),
  updated = vapply(timely_stars, "[[", "", "updated_at"),
  now = lubridate::as_datetime(Sys.time())
  )
Finally, because I didn’t want to hammer the API every time I re-ran my script, I saved the result to a csv for safekeeping.
readr::write_csv(stars, "../../static/data/stars_df.csv")You can find the csv saved here.
Exploring the starred repositories
I performed some simple calculations on how old Kent’s repositories are, how long they’d been dormant and how long they had been active for, as well as an indicator of if they had been active in the last 30 days.
stars <- stars %>%
  mutate(
    age = now - created,
    dormant = now - updated,
    length_active = updated - created,
    still_active = factor(if_else(dormant/60/24 <= 30, "Yes", "No"))
    )
Frustratingly the date arithmetic seemed to return the durations in different formats. One in days, one in minutes and one in seconds, meaning I had to transform as I went.
The first thing I looked at was the split between active and inactive repositories in Kent’s stars (defining still active as anything updated within the last 30 days).
stars %>%
  ggplot(aes(still_active, fill = still_active)) +
  geom_bar(stat = "count") +
  scale_fill_manual(name = "Repo still active",
                    values = c("#2A598B", "firebrick")) +
  labs(
    x = "Still Active?",
    y = "Repos",
    title = "The majority of repositories are still active",
    subtitle = "Although a LOT are dormant",
    caption = "Source: GitHubAPI, timelyportfolio's starred repositories"
    ) +
  theme_minimal() +
  theme(legend.position = "none")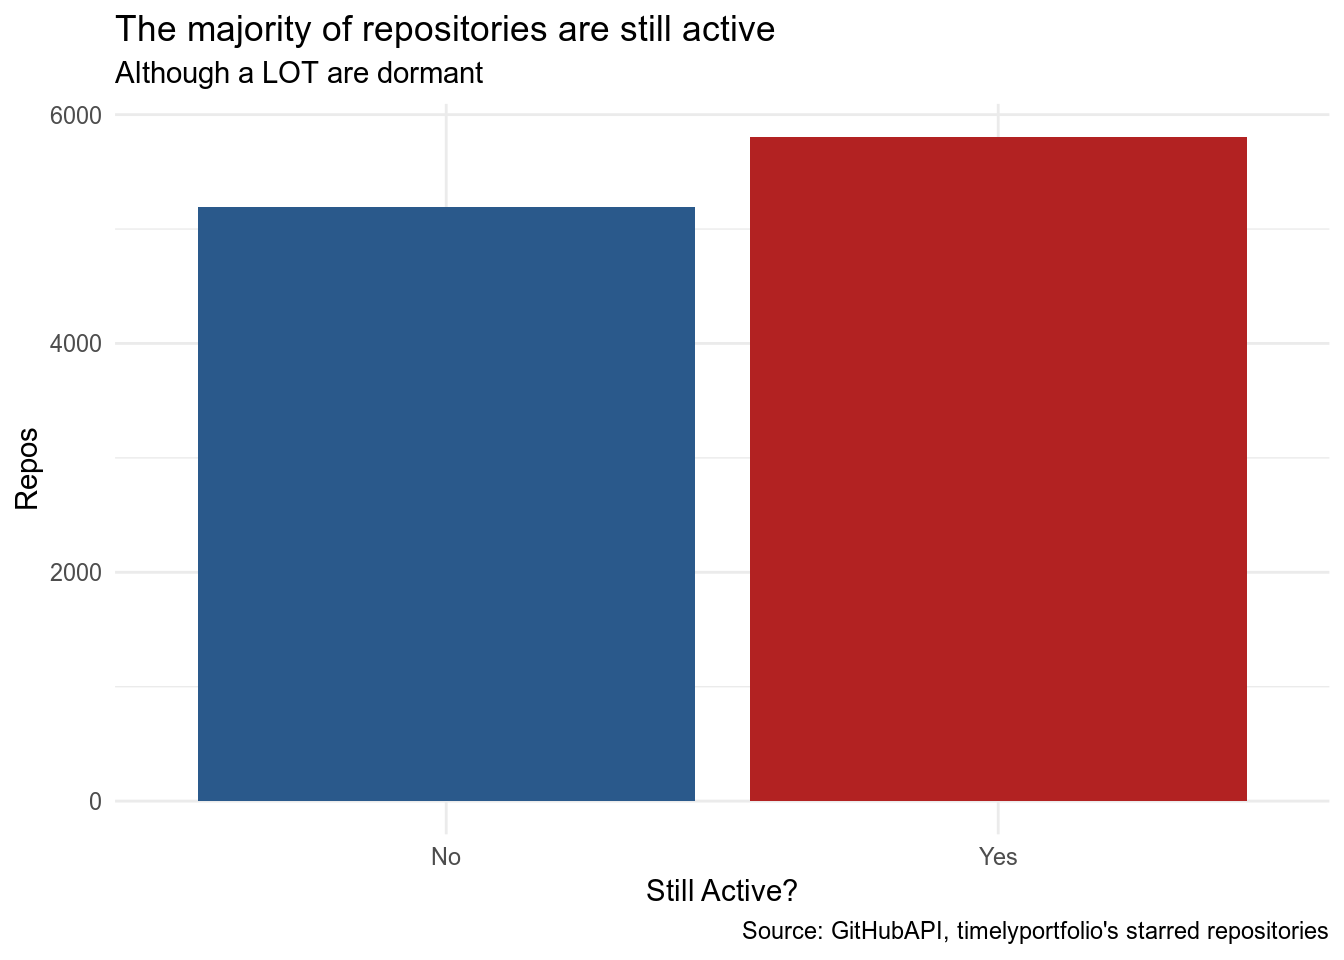
The next thing I thought to look at was how old some of Kent’s starred repositories are, and whether there was a relationship between a repository’s age and if it was still active or not.
stars %>%
  ggplot(aes(as.numeric(age))) +
  geom_histogram(aes(fill = still_active), colour = "white", binwidth = 30) +
  scale_fill_manual(name = "Repo still active",
                    values = c("#2A598B", "firebrick")) +
  labs(
    x = "Age (days)",
    y = "Repos",
    title = "Older repositories tend to still be active",
    subtitle = "Some of Kent's starred repositories are VERY old",
    caption = "Source: GitHubAPI, timelyportfolio's starred repositories"
    ) +
  theme_minimal() +
  theme(legend.position = "bottom")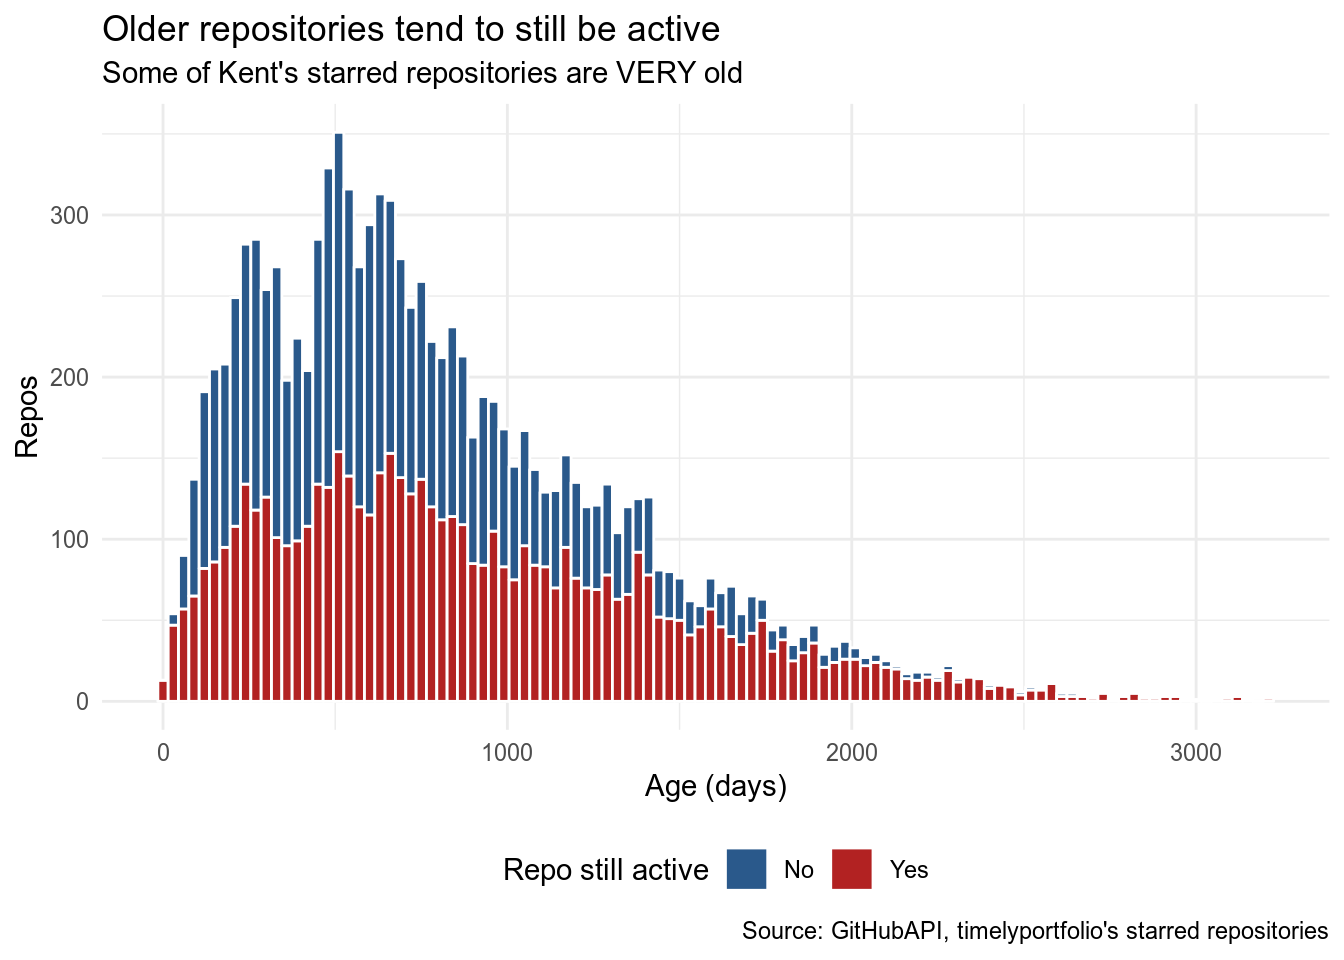
Wow, some of these repositories were created when I was just starting university. I feel young!
It looked like there was a difference between those repositories still active and those not. Generally speaking, older repositories were still active. I wondered if there was a statistical difference in age between the two groups, so I did a very simple t-test to find out.
t.test(age ~ still_active, data = stars)##
## Welch Two Sample t-test
##
## data: age by still_active
## t = -19.788 days, df = 10741, p-value < 2.2e-16
## alternative hypothesis: true difference in means is not equal to 0
## 95 percent confidence interval:
## -216.1804 days -177.2114 days
## sample estimates:
## Time differences in days
## mean in group No mean in group Yes
## 710.2145 906.9103The simple t-test said there was a significant difference: still-active repositories tended to be older by about 200 days. This made sense if I thought that older repositories were more likely to be popular, well-used and (therefore) regularly updated.
Finally, for those repositories that are (sadly) no longer maintained, how long did it take them to stop being maintained? My cut-off of “have to be active in the last 30 days” was a bit arbitrary (and a bit strict) so this wasn’t ever going to produce a a clear-cut analysis but I was interested nevertheless.
stars %>%
  filter(still_active == "No") %>%
  ggplot(aes(as.numeric(length_active)/60/60/24)) +
  geom_histogram(fill = "#2A598B", colour = "white", binwidth = 30) +
  labs(x = "Time between creation and going inactive (days)",
       y = "Repos",
       title = "Most inactive repositories became so very soon after creation",
       subtitle = "Although some stuck around a long time",
       caption = "Source: GitHubAPI, timelyportfolio's starred repositories") +
  theme_minimal()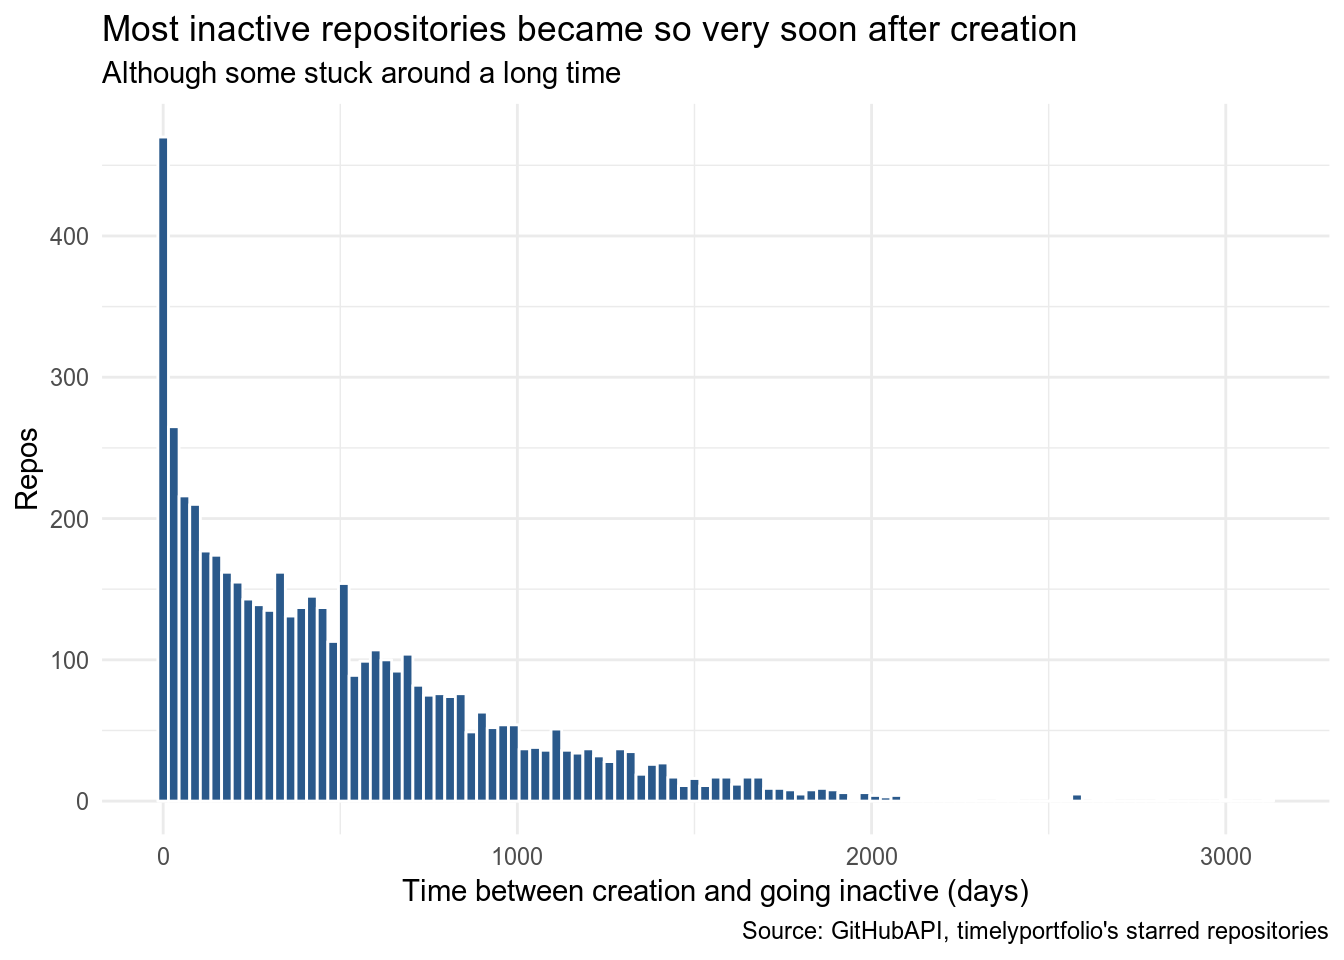
As I suspected, most inactive repositories became inactive very shortly after they were created. There are a number of projects that were clearly running for a long time before they became inactive, though. Some of those may have been included due to my hard cut-off of 30 days, of course. It would be interesting to know the story behind some of those repositories that were actively developed for a long time (several years for some of them) before finally being left dormant.